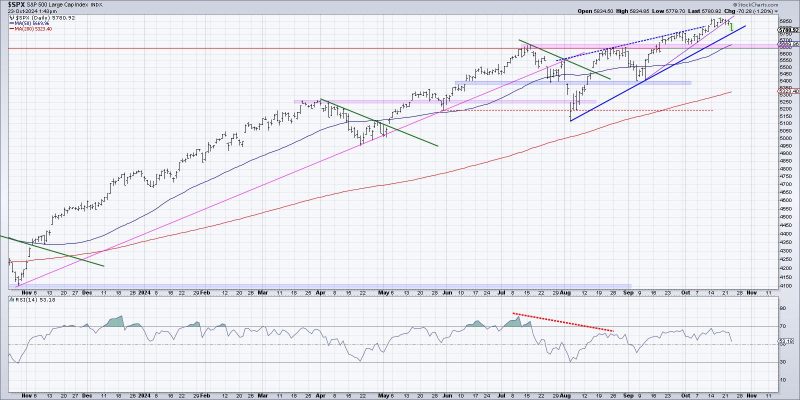
Unlocking the Secrets of Spotting the Beginning of a Distribution Phase: Three Visual Strategies
Three Ways to Visualize the Start of a Potential Distribution Phase
1. Volume Analysis:
One effective way to visualize the start of a potential distribution phase in the financial markets is through volume analysis. Monitoring the volume of trading activity can provide crucial insights into the strength of a market trend. In the case of a distribution phase, you may observe a decrease in trading volume compared to the previous accumulation phase or the earlier uptrend. This decline in volume indicates that the enthusiasm of buyers is waning, and sellers may be gradually gaining control over the market. By analyzing volume trends in conjunction with price movements, traders can anticipate a potential shift in market sentiment and be better prepared to adjust their positions accordingly.
2. Price Patterns:
Another method to visualize the beginning of a distribution phase is through the identification of specific price patterns on a price chart. Common patterns associated with distribution phases include head and shoulders formations, double tops, or rising wedges. These patterns typically indicate that the market is struggling to push higher and may be reaching a point of exhaustion. Traders who can recognize these patterns early on have the advantage of anticipating a potential reversal in trend and can take appropriate action to protect their positions or even profit from shorting the market. By studying price patterns meticulously, traders can gain valuable insights into market dynamics and improve their ability to make informed trading decisions.
3. Relative Strength Analysis:
A third method to visualize the start of a potential distribution phase is through the use of relative strength analysis. By comparing the performance of a particular asset or market sector to a relevant benchmark index, traders can assess whether there is underlying weakness or divergence that may signal the onset of a distribution phase. For example, if a stock is underperforming the broader market index despite previously strong performance, it could be a red flag indicating distribution by institutional investors or smart money. By monitoring relative strength indicators and conducting sector analysis, traders can stay ahead of potential trend reversals and position themselves strategically to capitalize on changing market conditions.
In conclusion, visualizing the start of a potential distribution phase in the financial markets requires a keen understanding of various technical indicators and analytical tools. By incorporating volume analysis, price patterns, and relative strength analysis into their trading strategies, traders can enhance their ability to identify early warning signs of a market reversal and adapt their positions accordingly. Staying vigilant and continuously honing one’s technical analysis skills are essential for navigating the complexities of the financial markets and achieving long-term trading success.
