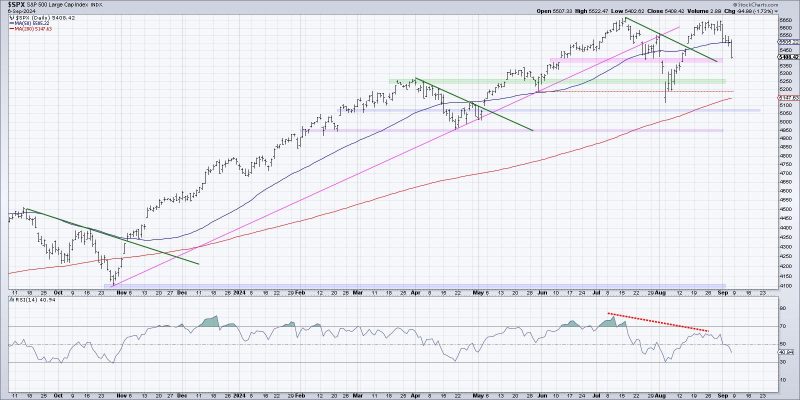
Chart #1: The S&P 500’s Price-to-Sales Ratio Reaches All-Time Highs
One of the key indicators signaling a potential market top is the price-to-sales (P/S) ratio of the S&P 500 Index. As depicted in Chart #1, the S&P 500’s P/S ratio has been climbing steadily over the past few years and recently hit an all-time high. The P/S ratio is a valuation metric that compares a company’s stock price to its revenue per share. A high P/S ratio indicates that investors are paying a premium for each dollar of a company’s sales.
Historically, elevated P/S ratios have often been followed by market corrections or bear markets. When the market becomes overvalued in relation to the underlying companies’ revenue, it can be a red flag that investors are excessively optimistic about future earnings growth. This exuberance can lead to a market pullback as reality sets in and valuations revert to more reasonable levels.
Investors should keep a close eye on the S&P 500’s P/S ratio as an indicator of market froth. While high valuations alone do not necessarily signal an imminent crash, they do suggest that caution is warranted, and that a healthy dose of skepticism should be applied to market expectations.
Chart #2: Margin Debt Surges to Record Highs
Margin debt, as illustrated in Chart #2, is another metric that can provide insights into market exuberance. Margin debt is the money borrowed by investors from their brokers to purchase securities, and high levels of margin debt can indicate that investors are leveraging up in a bid to maximize gains in a rising market.
When margin debt surges to record highs, as it has recently, it can be a warning sign that market participants are taking on excessive risk. Margin buying amplifies both gains and losses, as investors are using borrowed money to speculate on stock prices. If the market turns south, margin calls may be triggered, leading to forced selling and exacerbating the decline.
While margin debt is not a perfect predictor of market downturns, history has shown that extreme levels of leverage can contribute to market volatility and sharp corrections. Investors should be mindful of the risks associated with margin trading and consider the potential impact of a margin debt unwinding in a market downturn scenario.
Chart #3: The VIX Index Hits Extreme Lows
The VIX Index, commonly referred to as the market’s fear gauge, measures the expected volatility in the S&P 500 over the next 30 days. In Chart #3, we can observe that the VIX Index has reached extreme lows, signaling a lack of fear and complacency among investors.
Low levels of volatility, as indicated by a depressed VIX, can suggest that market participants are overly confident and underestimating potential risks. When investors become too complacent, they may be ill-prepared for unexpected events or shifts in market sentiment that could trigger a rapid increase in volatility and lead to swift market corrections.
While prolonged periods of low volatility can persist for some time, they are often followed by spikes in volatility as market conditions change. Investors should be cautious when the VIX Index is at extreme lows, as it may indicate a heightened risk of a sudden market downturn or increased turbulence ahead.
In conclusion, monitoring key indicators such as the S&P 500’s P/S ratio, margin debt levels, and the VIX Index can provide valuable insights into market conditions and potential warning signs of a market top. While no single metric can predict market movements with certainty, a combination of these indicators can help investors assess the level of risk in the current market environment and make informed decisions about their investment strategies. Staying vigilant, managing risk, and maintaining a diversified portfolio remain essential principles for navigating the ever-changing landscape of the financial markets.

