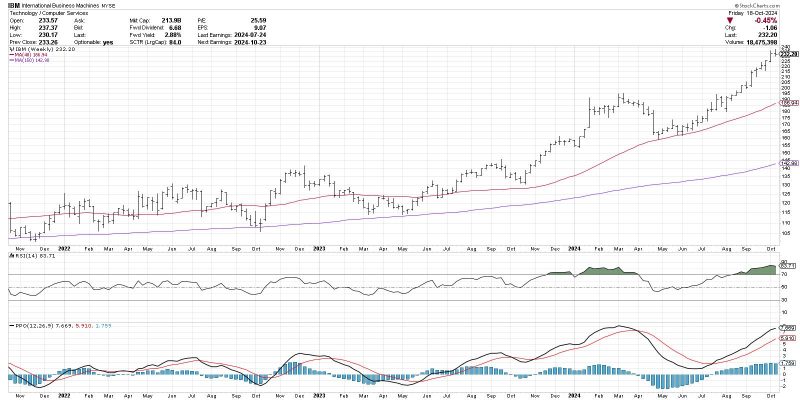
Unveiling the Hidden Power of the MACD Histogram in Predicting Trend Shifts
The Moving Average Convergence Divergence (MACD) indicator is a popular tool used by traders to identify potential trend changes in financial markets. One lesser-known component of the MACD is the MACD Histogram, which can provide valuable insights for anticipating trend reversals and capturing profitable trading opportunities.
### Understanding the MACD Histogram
The MACD Histogram is derived from the MACD line and the signal line. It represents the difference between these two lines and provides a visual representation of the relationship between them. When the MACD line crosses above the signal line, the histogram will move above the zero line, indicating a bullish trend. Conversely, when the MACD line crosses below the signal line, the histogram will move below the zero line, signaling a bearish trend.
### Anticipating Trend Changes
One of the key advantages of the MACD Histogram is its ability to anticipate trend changes before they occur. Traders can look for divergences between the price action and the histogram to identify potential reversal points. For example, if the price is making higher highs while the histogram is making lower highs, this could signal a weakening trend and a possible trend reversal.
### Confirmation of Trend Strength
In addition to predicting trend changes, the MACD Histogram can also help confirm the strength of a trend. A widening histogram indicates increasing momentum in the current trend, while a narrowing histogram suggests that the trend may be losing steam. Traders can use this information to adjust their trading strategies and make more informed decisions.
### Trading Strategies Using the MACD Histogram
Traders can employ various strategies using the MACD Histogram to enhance their trading performance. One common strategy is to look for crossovers of the histogram and the zero line. When the histogram crosses above the zero line, it can be a signal to enter a long position, while a crossover below the zero line could indicate a potential short opportunity.
### Conclusion
In conclusion, the MACD Histogram is a powerful tool that can help traders anticipate trend changes, confirm trend strength, and develop effective trading strategies. By incorporating the MACD Histogram into their analysis, traders can gain valuable insights into market dynamics and improve their trading results. Whether used in conjunction with other technical indicators or on its own, the MACD Histogram holds the potential to unlock the secrets of trend forecasting and enhance trading profitability.
