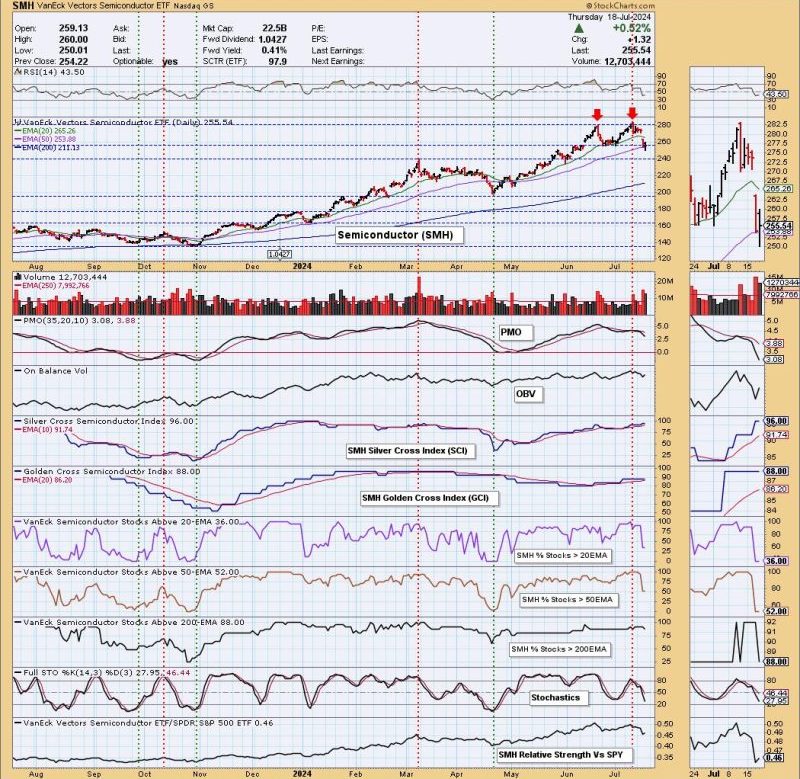
In recent weeks, the semiconductor sector has shown signs of hesitation as the SMH ETF formed a distinct double top pattern, raising concerns among investors about the potential for a reversal in the bullish trend. The double top pattern is considered a bearish technical indicator, signaling a possible trend reversal from an uptrend to a downtrend. Let’s take a closer look at the implications of this pattern on the semiconductor sector and what traders might expect going forward.
Double top patterns are formed when a security’s price reaches a peak, retraces, then rallies back to the previous peak before experiencing a downward movement. This creates two peaks at a similar price level, forming the characteristic M shape of a double top. The pattern suggests that the asset is struggling to break above a certain price level, ultimately leading to a potential trend reversal.
For the semiconductor sector, the formation of a double top pattern on the SMH ETF could indicate a loss of momentum in the sector’s rally. As semiconductors play a crucial role in various technological applications, including smartphones, computers, and automotive electronics, any weakness in this sector can have widespread implications for the overall market sentiment.
Investors and traders are closely watching the price action of semiconductor stocks, as a confirmed breakdown below the pattern’s neckline could signal a shift towards a bearish trend. The neckline is a support level that connects the low points of the two peaks in a double top pattern. A decisive break below this level would confirm the pattern and indicate a potential downside target based on the pattern’s height.
However, it is important to exercise caution when interpreting technical patterns such as double tops, as they are not foolproof indicators of future price movements. Traders should consider other factors such as fundamental analysis, market trends, and external events that could impact the semiconductor sector’s performance.
In conclusion, the formation of a double top pattern on the SMH ETF raises caution flags for investors in the semiconductor sector. While this pattern suggests a potential trend reversal, it is essential to monitor the price action closely and consider additional factors before making any trading decisions. Stay alert to market developments and be prepared to adapt your trading strategy as the situation evolves.

